Are Bike Lanes a Sign of Gentrification?
An Open Design Investigation
Cycling as a means of transportation has been on the rise in the U.S. over the past couple decades, as measured by the League of American Cyclists, the oldest and most active bike advocacy organization in the country. Compiling data from the American Community Survey, they annually list cities with the highest share of bike commuters, in addition to their ratings of Bike Friendly Communities on their own criteria of safety, infrastructure, enforcement, advocacy, and education.
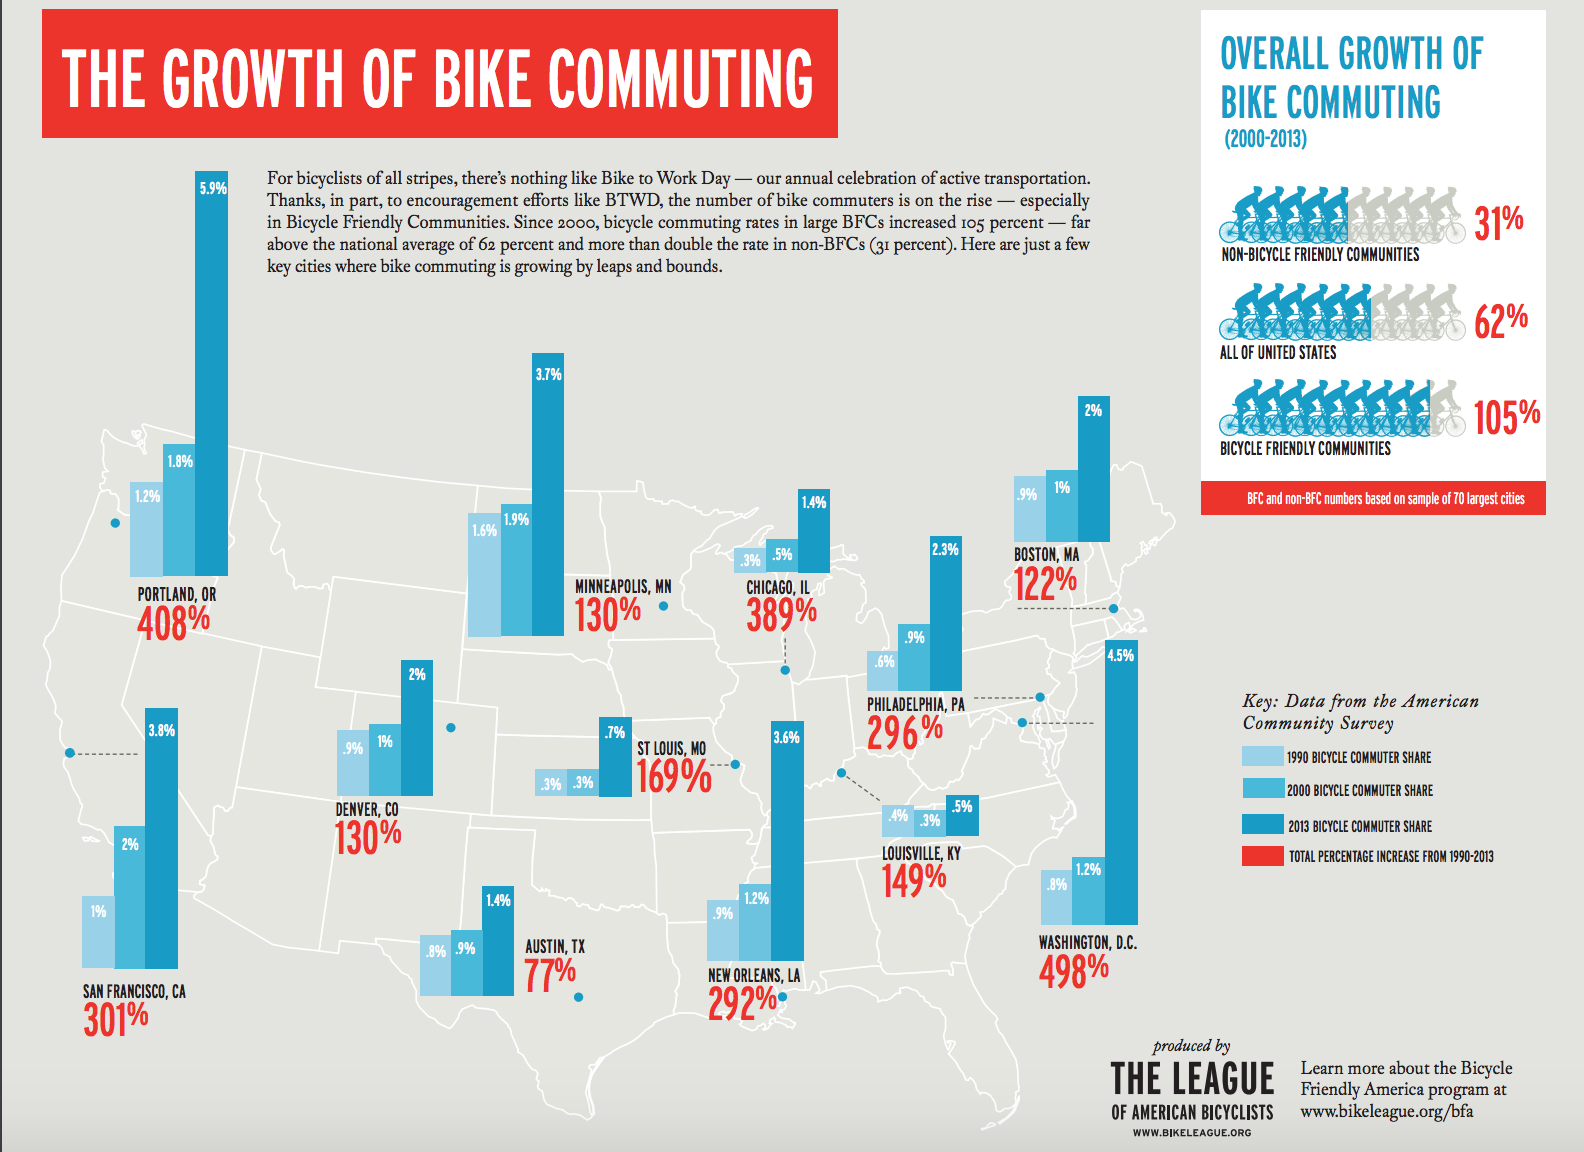
Austin is frequently featured in these lists, and has a de-facto “bike culture” by way of social rides and inventive bike programs (such as Yellow Bike Project, Frankenbike Project, and Social Cycling Austin to name a few). But for some neighborhoods in Austin the perception is less positive. The appearance of bike lanes in a community can sometime be signs of gentrification, that is, lanes are seen as not being built for the residents that currently live in the area but for those intended to move to that area, currently moving to that area, or simply from another area of the city altogether.
A National Trend
The link between bike lanes and gentrification is not unique to Austin. Contentious public battles over bike lanes have led to an awareness of its connections to economic inequality and capital improvement. In the past few years articles have been written attempting to deconstruct this chicken-and-egg scenario, focusing on major cities in the U.S. such as Chicago, New York, Washington D.C., Austin, and Portland, to name a few. Most articles even writing about gentrification in general site bike lanes an indicator.
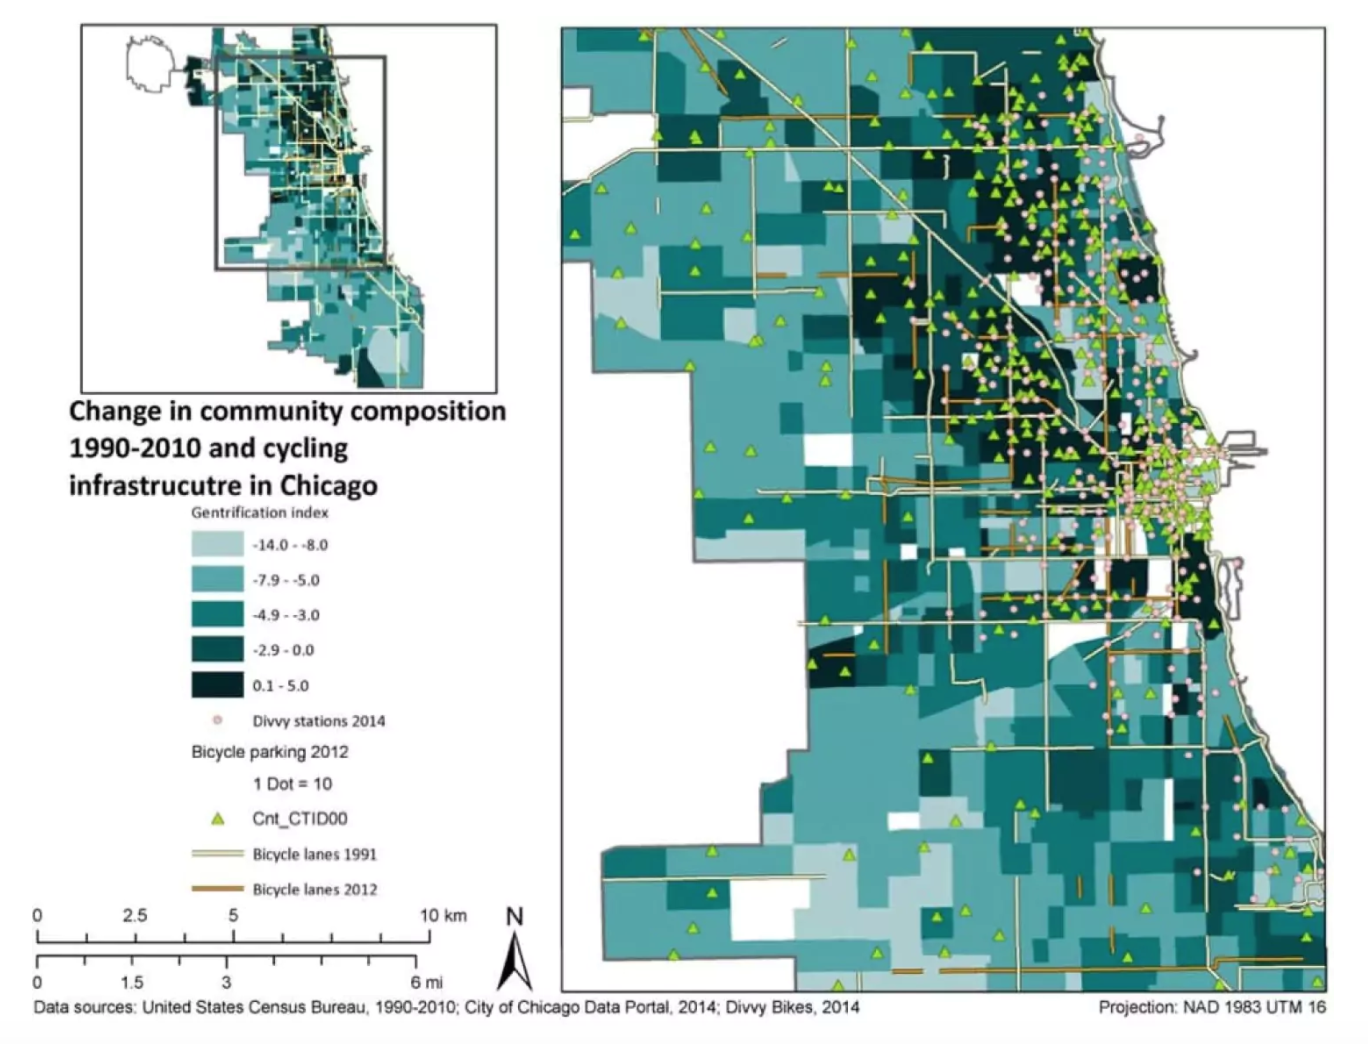
One article in particular from the Washington Post featured Elizabeth Flanagan, Ahmed El-Geneidy and Ugo Lachapelle, a team from McGill University and University of Montreal, who tried to measure this exact issue with open data. By rating census tracts of a city based on a “gentrification index” and overlaying bike facilities such as bike share programs, lanes, and racks, patterns can be revealed. Lines of bike facilities seem to correlate with the sprawl of affluence, increased home prices, and decreased racial diversity (darker regions below).
Defining Gentrification
Measuring gentrification is a difficult task, and first begins with a definition. In general it is defined as the transformation of a “deteriorating” neighborhood into middle-class through “urban renewal” initiatives meant to attract a more affluent population (I add quotes to these words because they are often challenged by their criteria and methods). The intent of gentrification has been to renew an urban area through a mixing of diverse incomes and opportunities, but the effect is typically only homogeneous progression. In a 2014 paper, Dr. Eric Tang and Dr. Bisola Falola shed light on this salient process happening in East Austin. Given the socio-economic makeup of the U.S. in addition to historically discriminatory city policies, the effect of this initiative tends to displace working- and lower-class Black and Hispanic/Latinx populations through increased cost of living and housing markets, declining job opportunities, and systemic racism.
Open Source Data in Austin
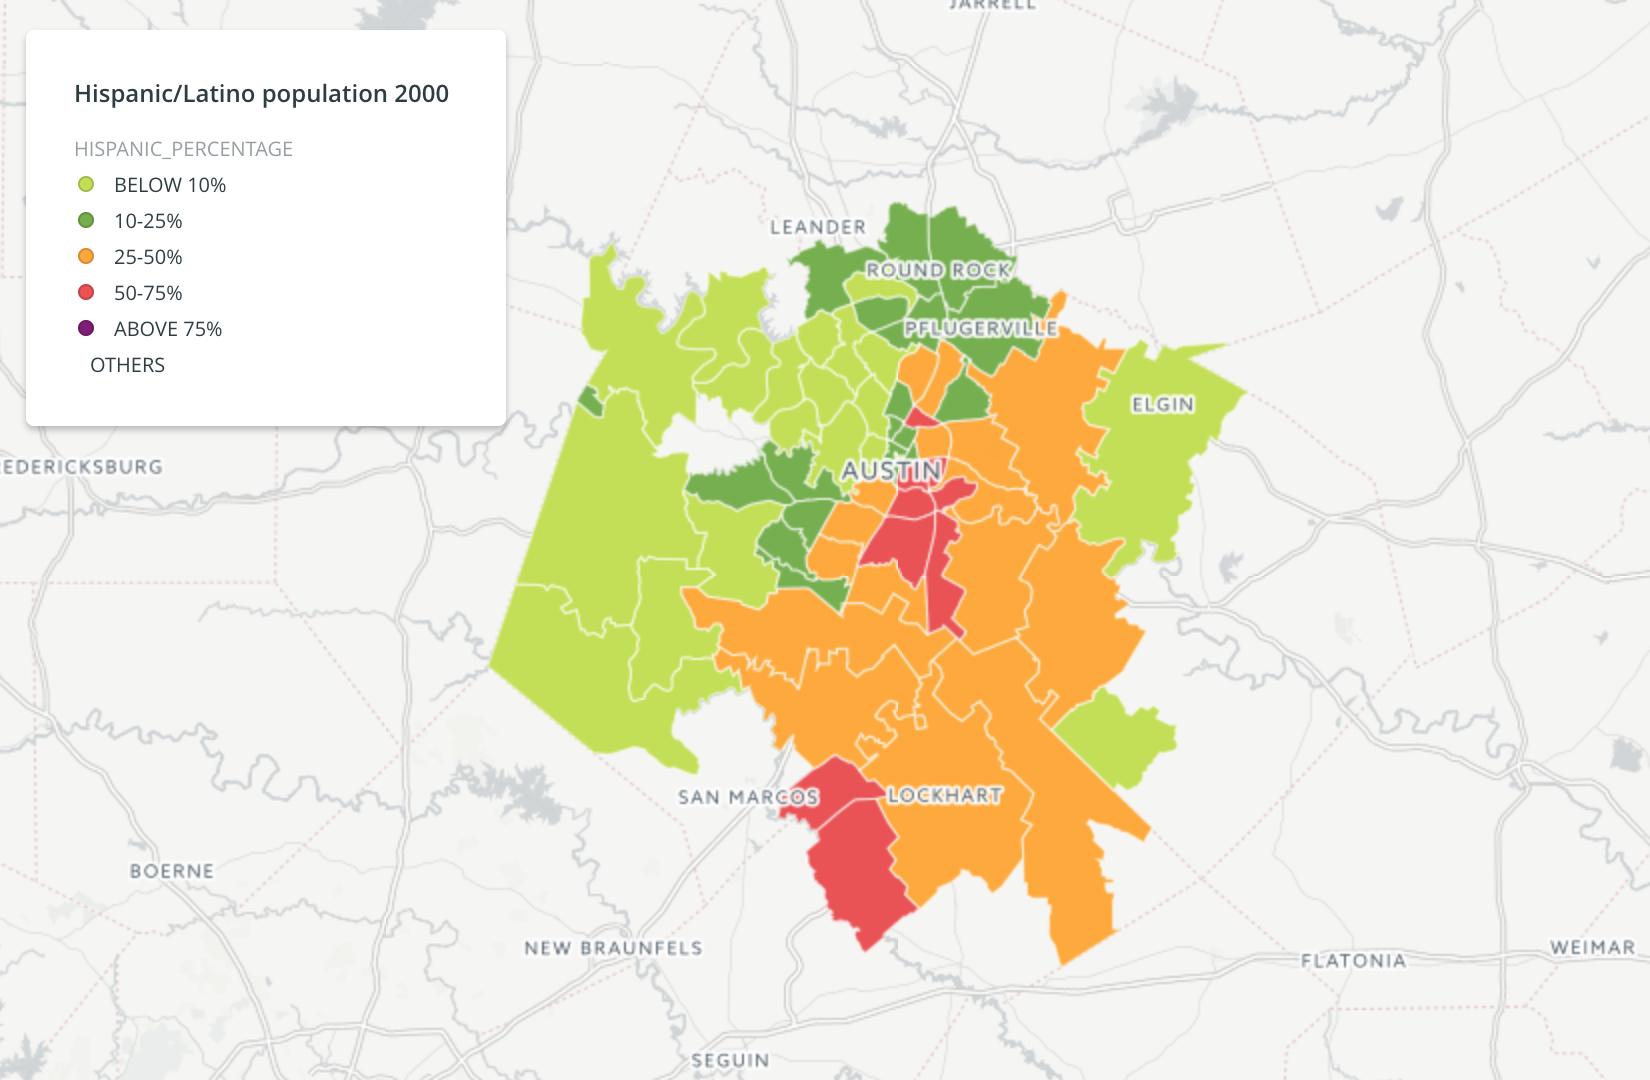
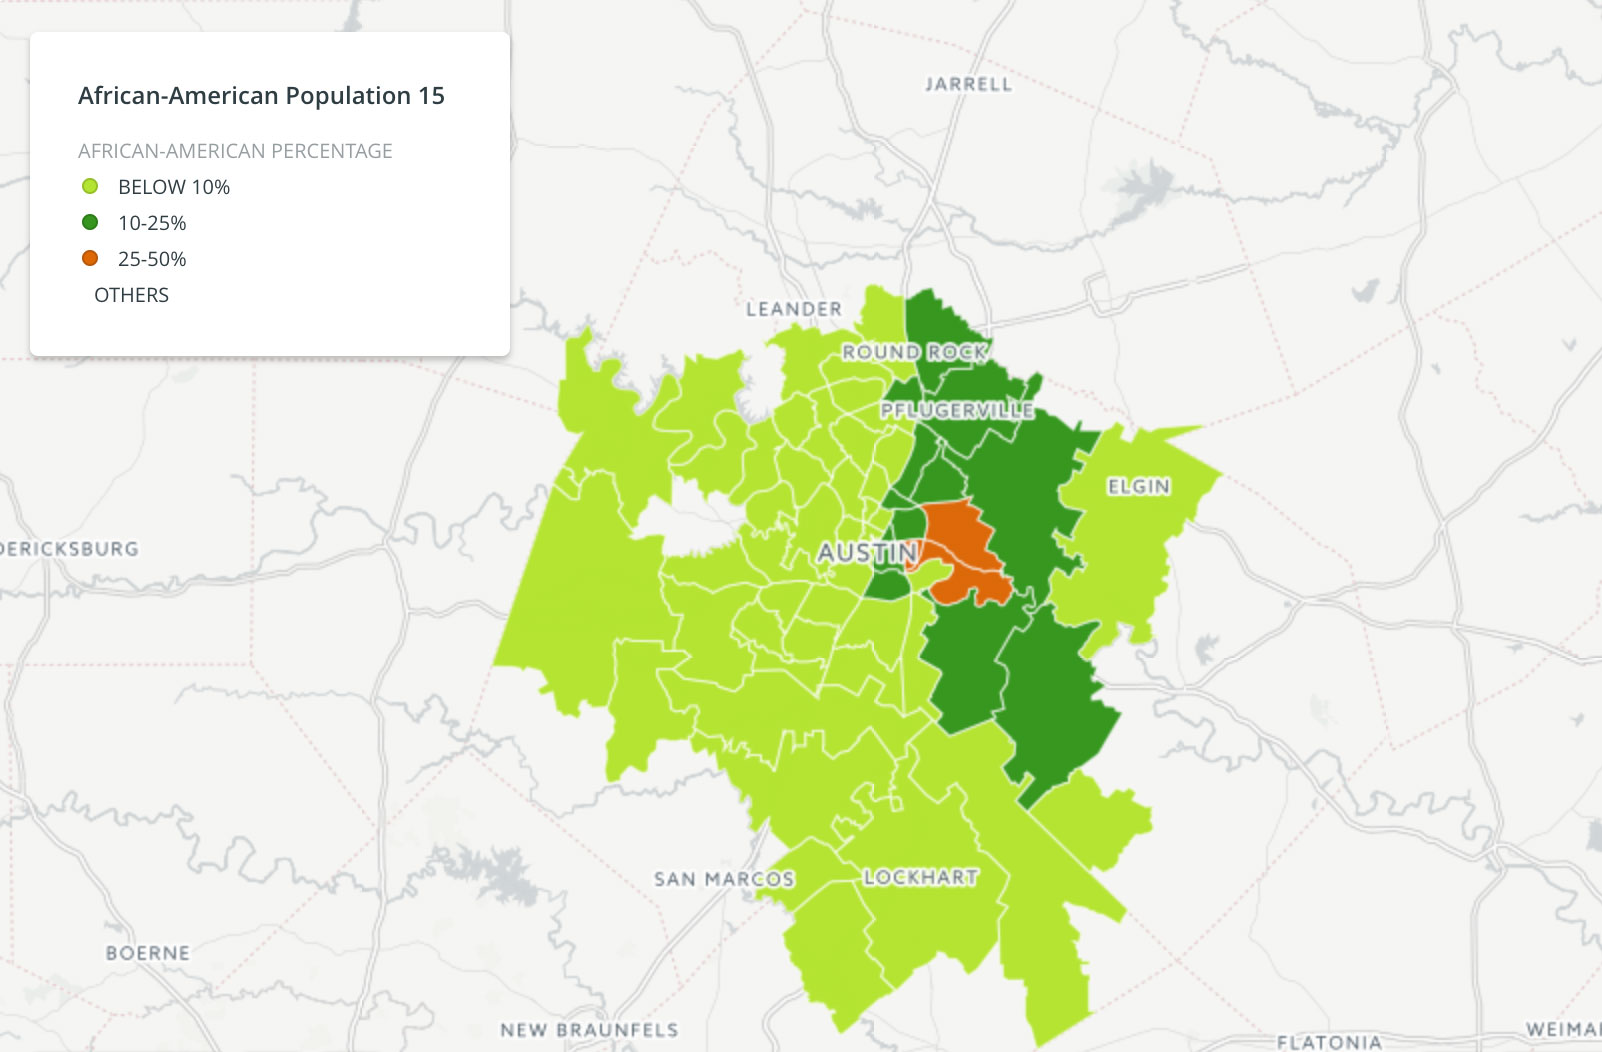
It seems that gentrification is measured by demographics, and defined by intent. In trying to find a correlation between gentrification and commuter bike infrastructure, I started looking at the displacement of non-white populations in Austin. Isolating the area to zip codes provided by Austin’s Open Data Portal, and gathering demographics from the US Census, I was able to visually represent the change in population density and median house prices from 2000 to 2015.
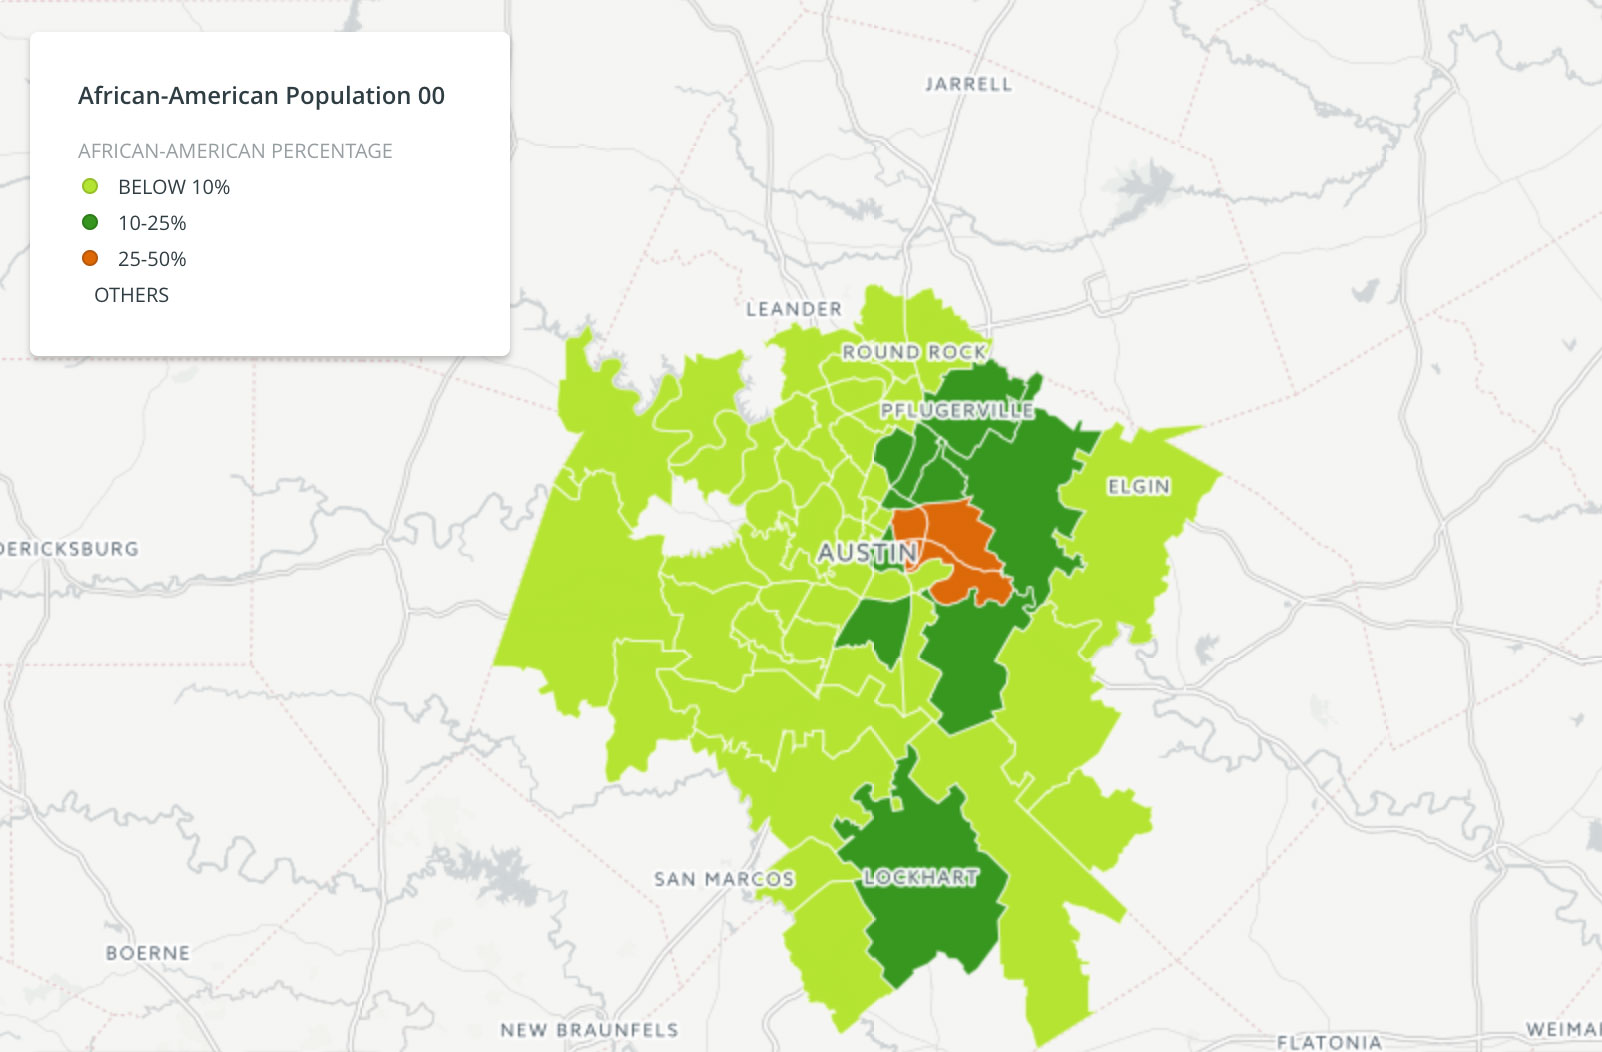
Change in Hispanic/Latinx and Black populations by Austin zip codes between 2000 and 2015.
While population grew overall in all sectors, here we can see a shift in the location of Hispanic/Latinx households. Particularly of note is an increase of population further out from the city center, and further east. The same migration can be seen in Black populations, however in declining numbers. We can also see an indication of concentration of these households to neighboring zip codes, what Tang and Falola identify as a possible precursor to eventual gentrification, sometimes even decades later.

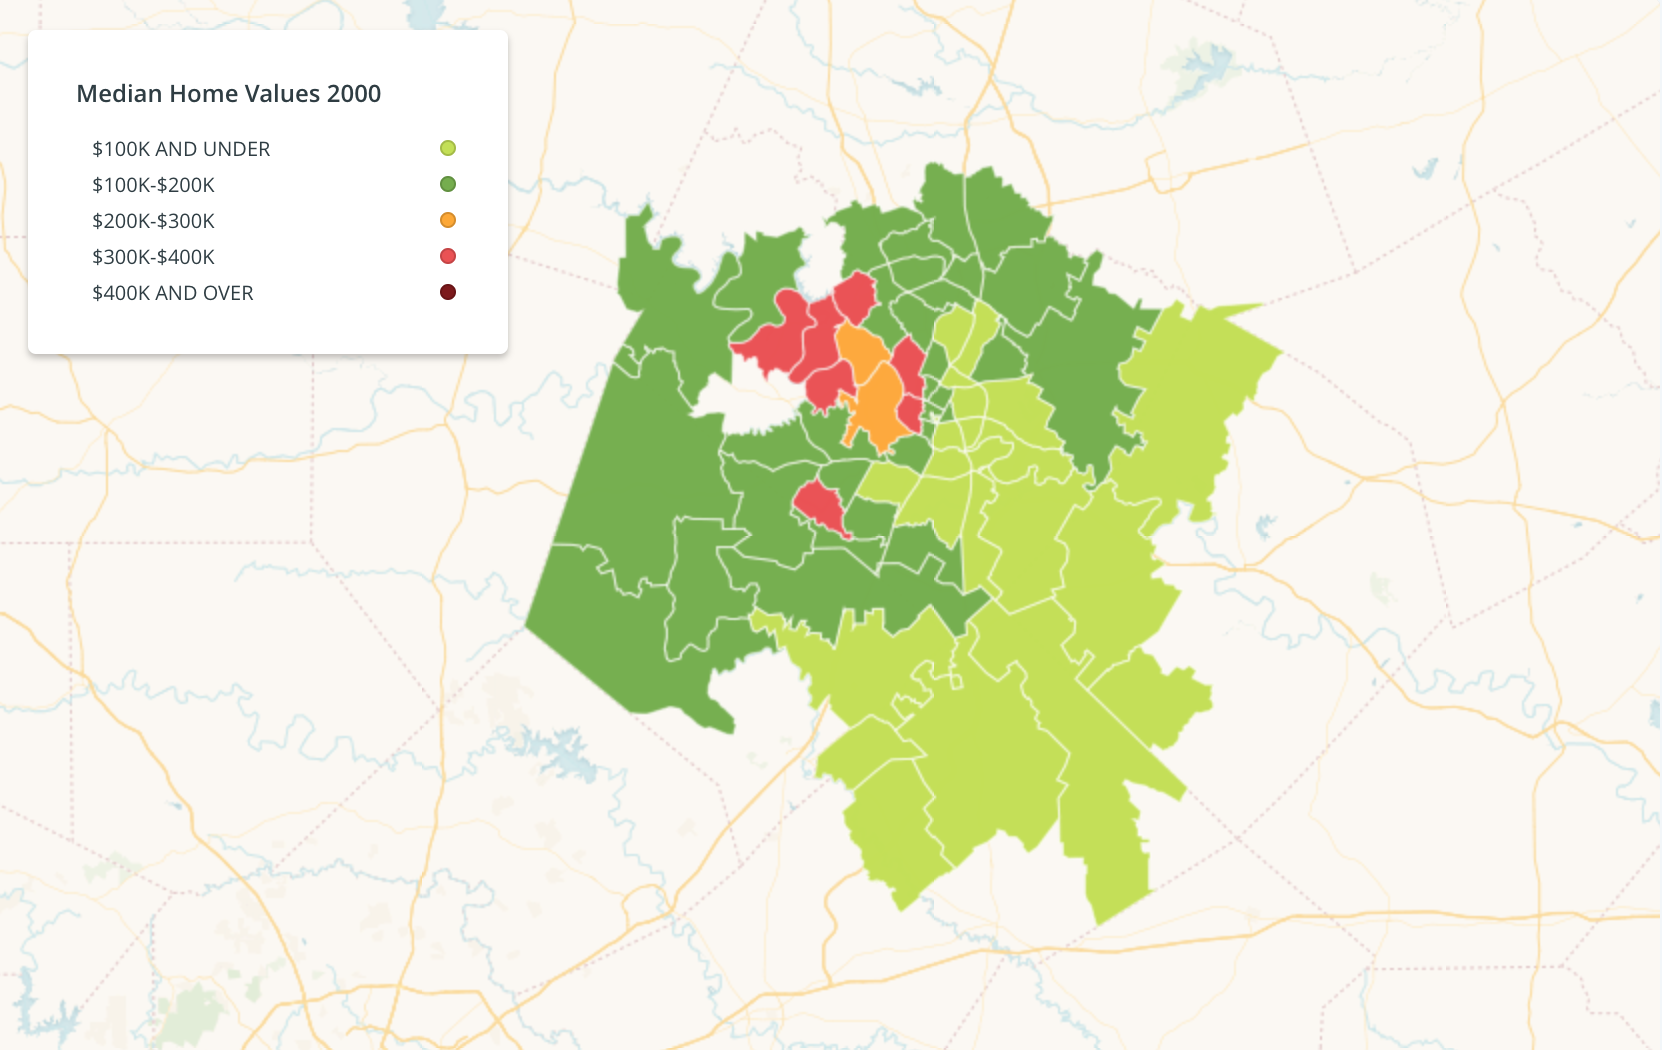
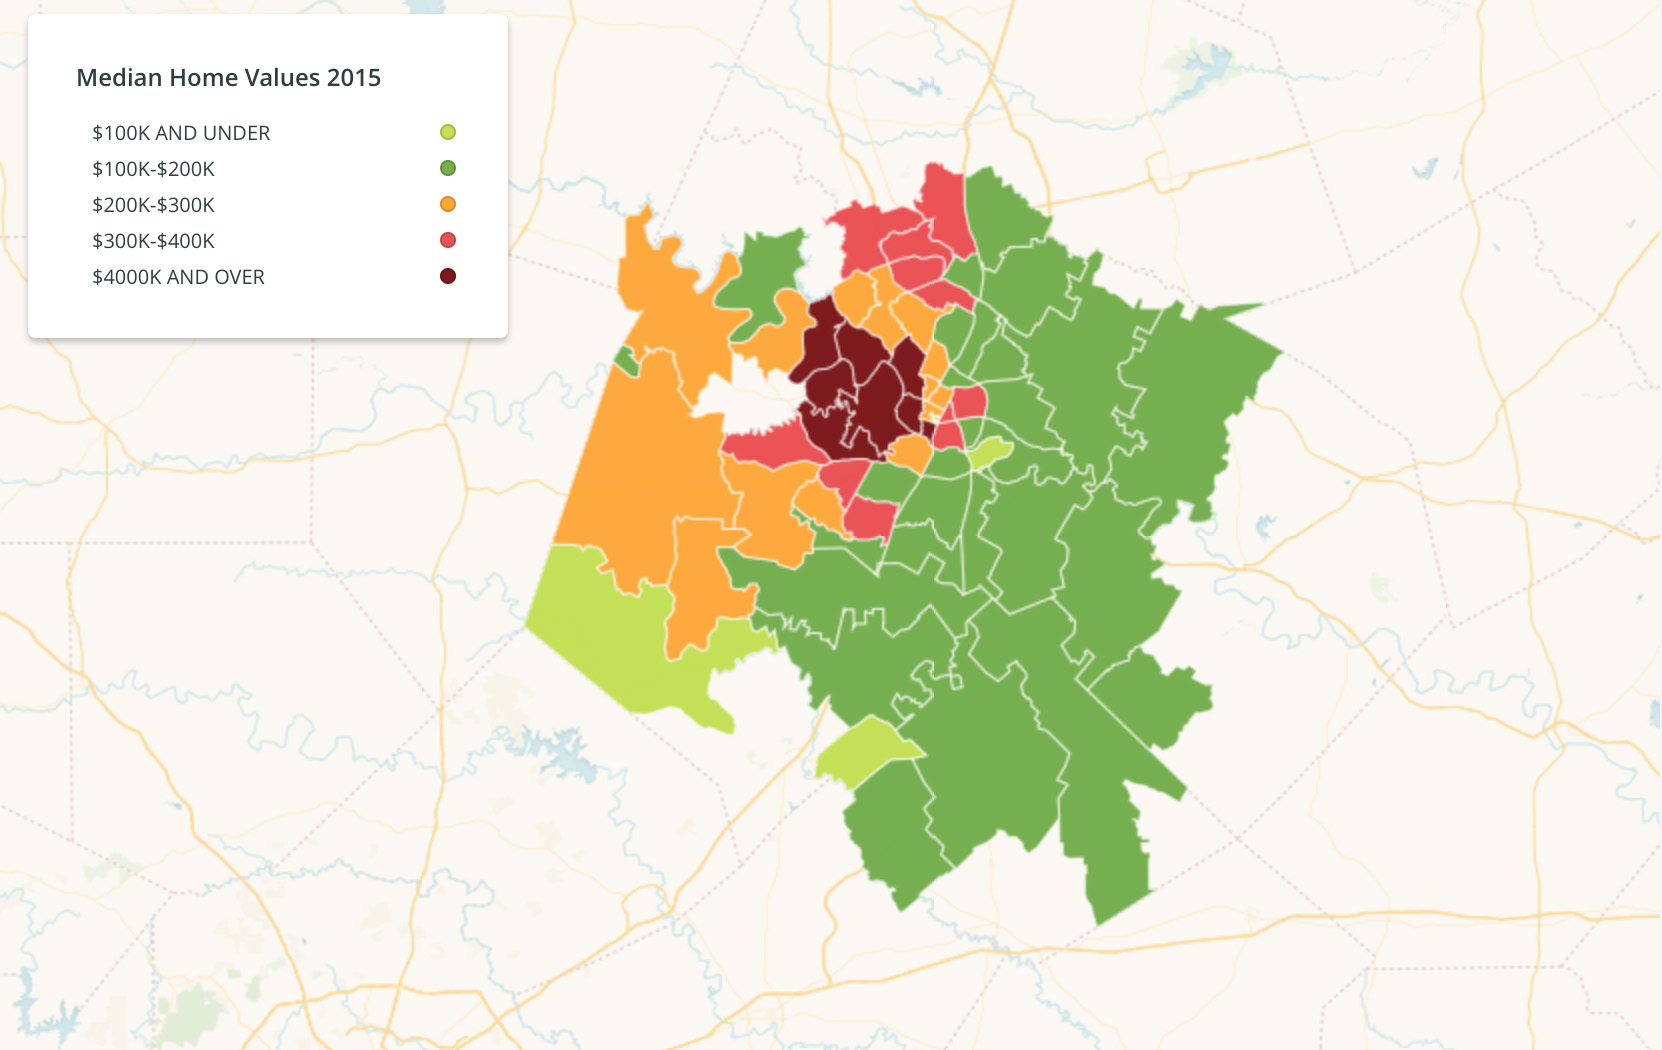
Change in Median Home Values between 2000 and 2015
As with most cities experiences an influx of population over a 15-year span, cost-of-living also increases particularly in the housing sector. We can see a clear east/west divide in home prices that correlates with zips that have higher distributed white populations, and lower more concentrated Hispanic/Latinx and Black populations.
Quantifying Gentrification
I then took inspiration from Elizabeth Flanagan, Ahmed El-Geneidy and Ugo Lachapelle, and scored individual zip codes on the following criteria:
- An increase in white population
- A decrease in Hispanic/Latinx population
- A decrease in Black population
- An increase in median home values (adjusted for inflation) above average national increases
Through Austin’s Open Data Portal I was also able to plot B-Cycle kiosk locations and current bike lanes. The bike lane dataset also includes a prioritization of general improvements, most likely based the highest share of usage.
Here we can see a mapping similar to the gentrification index created by Flanagan, El-Geneidy and Lachapelle. The weighted zip codes of demographics match the locations (almost down to the boundary lines) of B-Cycle kiosk, as well as the one-street bike facilities, especially along East 6th, 5th, and 2nd street corridors infamously targeted for renovation and development.
Conclusions
Gentrification is a hard thing to nail down, and as so many other people before me have already studied, it’s tough to determine whether bike lanes are bi-product of urban renewal, an economic pastime for affluent elite, or worse, a democratic means of mobility being hijacked and commodified for profits. This study is only peek into the many factors that are at play into the growth of a city and its leaders, and the impacts of infrastructure.
Open (Re)sources
- Open Data Austin (bike lanes, B-Cycle locations, bike rack locations)
- FactFinder sourcing American Community Survey (demographics 2010-2015)
- US Census (demographics 2000)
- Google Sheets (editing of datasets)
- WordPress (open source website platform)
- Coherent (free WordPress theme)
- Carto (location-based data visualization tool)
- The Economist (average home sale prices)
- Unsplash (banner photo)
Articles
- https://www.pdx.edu/ims/sites/www.pdx.edu.ims/files/RussillBoylegentrification.pdf
- https://www.washingtonpost.com/news/wonk/wp/2016/01/14/why-bike-lanes-are-hugely-unpopular-in-some-neighborhoods/?utm_term=.4c4bcafc9a27
- https://www.theguardian.com/cities/2016/oct/05/blame-bike-cycling-contribute-city-gentrification
- http://www.huffingtonpost.com/jay-walljasper/do-bike-lanes-promote-gen_b_4178505.html
- https://www.portlandoregon.gov/bps/article/454027
- http://housingworksaustin.org/wp-content/uploads/2016/12/HousingWorks-Impact-2016.pdf
- http://kut.org/post/b-cycle-expanding-so-why-are-all-new-stations-near-downtown
- https://liberalarts.utexas.edu/iupra/_files/pdf/those-who-left-austin.pdf